Scoring with event statistics
Jennifer Brown
News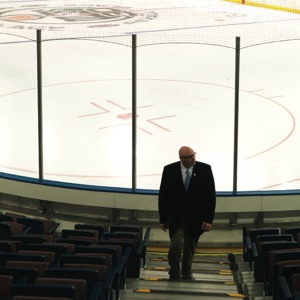 When it’s game night in Edmonton and the Oilers are playing the Calgary Flames, Dave Suffern knows it’s going to be a busier night than usual.
It doesn’t take special software or statistical analysis to know this,
but what reporting tools can help him with is in determining where the
trouble spots are likely to flare up and what entry points illegal
drugs might be coming from. With 16,500 fans at the Rexall Centre, he
can use all the help he can get.
Suffern, major event security manager for Northlands, the body that
manages five entertainment and sports venues in Edmonton, knows he’ll
have more activity going on in the stands when the Flames are in town —
more than any other team — and staffs his security team accordingly for
those nights.
Knowing exactly where in the building he needs to place personnel has
become easier thanks in part to incident reporting and investigation
management software from Edmonton-based PPM 2000, which was put in
place two years ago. The system is a centrally managed web services
application that can be updated and maintained across multiple sites —
critical for an organization like Northlands.
Northlands chose the Perspective Premium edition, and Suffern says it’s
proven to be a major improvement on what the organization had been
using to document incidents — a paper and pen system that didn’t really
allow for detailed analysis.
“You can imagine how difficult that was if you had to search it,” says
Suffern. “Basically people would go through it and collect what they
could. We found it really onerous.”
For example, during an Edmonton Oilers game any fan eviction or medical
incident was typically recorded on paper copy and put into a file.
“Basically, we wanted to identify who was involved in incidents and
what types of incidents we were dealing with. Once we started
collecting it in Perspective we could identify the types of incidents
and severity and locations, which was critical — whether it was first,
second or third period of a game. People had an idea of when things
were happening, but didn’t have the exact statistical information to
prove it.”
Now Suffern can see which door sets in the building were the location
for entry of drugs or alcohol and with which particular teams.
“Everyone had an idea of where incidents were generally happening, but
it was quite shocking when you started getting into the data to find
out what teams would be an issue in terms of the fan base,” he says.
Having those kinds of event statistics helps Northlands determine what
to budget for door security for particular games at the Rexall Centre,
and it helps with concerts and other events at its other properties.
Across its five buildings, Northlands runs more than 2,500 events a
year attended by over four million visitors. They include concerts;
trade shows; sporting events like NHL hockey and thoroughbred and
harness racing; gaming; and agriculture events such as the Canadian
Finals Rodeo.
Suffern was familiar with Perspective in previous security positions in
the health-care sector. He joined Northlands just as Perspective was
rolling out at the organization. Fulltime staff have access to the
system, while part-time employees still record events to paper and
their supervisors record it into the system to maintain.
“It’s a good way to keep the information clean,” says Suffern.
Suffern pulls information from each event which is forwarded to police and other groups.
On game night, there are 30 security staff, 15 city police and medics
and volunteers. Northlands averages about seven to 10 incidents per
hockey game ranging from the discovery of outside alcohol or drugs and
two or three intoxication or fan behaviour issues. That can range from
someone who refuses to follow staff direction to pounding on the glass
during the game. The total number of fan behaviour issues all depends
on the night.
“It really depends on whether it’s a long weekend, the team the Oilers
are playing, how well it’s doing or how poorly. Ultimately that’s how
the program helped us clear through a lot of that and you can get more
predictive in your analysis,” he says.
Planning for game night doesn’t just take into account what previous statistics have shown, says Suffern.
“It actually starts about two months prior to the season. We start
looking at what our rosters are going to be and hiring and training
staff for the event. We look at whether we’re going to have players
with more exposure because that’s going to increase how much you have
to do on a game night.”
Examination of the data allows Suffern and his team to identify problem areas.
“You look at gaming and liquor sales and intoxication issues and
evaluate your liquor program accordingly,” he says. “That’s how you get
the funding as well — the executive level needs to see the data and
it’s very methodical and structured. You can paint a picture of what
you’re dealing with and how much you should spend.”
The system was put into Northlands with the assistance of Dale
Yushchyshyn, Project Manager, Consulting & Training with PPM 2000
in Edmonton.
“They came in looking for something that could tie in security incidents along with risk management,” says Yushchyshyn.
A lot of the risk management incidents stemmed from situations that
were first reported to the security team. But Suffern had to find the
happy medium between the incidents that didn’t concern the risk
management department but security still needed to document.
Yushchyshyn says he had to take into account and plan for further
expansion at Northlands and changes/organizational structure when
rolling out the system.
“We had to go through and identify, what are the things each group
cares about? How do we segregate the data? Risk management didn’t want
security seeing their data or their information with some of these
incidents and some incidents risk management wanted to segregate out,”
he says.
“Any incident can be segregated out, so in this case we had two
specific groups who needed to work with Perspective — security and risk
management — but not all risk management incidents were visible to
security and vice versa. We had to find a way to allow sharing to occur
and segregation to occur.”
For example, if a visitor trips going up the stairs, security would
document the event, but it could go to litigation so risk management
takes over the incident.
Perspective also offers the ability to attach a business group or
department that is accountable to an incident. Northlands customized
that feature to identify the type of event occurring within a building
and break it down to a concert, and then what type of music was it and
what band was playing. If it was a hockey game they can track the
difference between junior hockey and NHL hockey and what the teams were
playing on the night the incident happened.
This aspect of the system Yushchyshyn says is underutilized. It’s
something the customer can do to determine root cause analysis.
“For example, with Edmonton/Calgary the games are nuts compared to
Tampa Bay,” says Yushchyshyn. “(Northlands) can track at what point
during the period or intermission something happens so they can track
trends to what alcoholic type incidents are happening.”
Suffern says he has put this to use at Northlands. "We use the analysis
section to determine events, times of incident, location, specific
seating, specific types of incidents etc. This again is used
extensively to obtain a "Snap Shot" of the event for future analysis
and preparation."
Print this page
Leave a Reply